6,101 spans. 801 production sessions. 622 execution traces. That's the instrumentation surface behind one production AI deployment. Most teams running agents in production have none of it — and they're debugging blind.
The gap between those two states is not a tooling gap. It's a mental model gap. Most teams believe they know where their agents fail. The span data says otherwise. Consistently.
Where Teams Think Agents Fail
When an AI agent misbehaves in production, the first question is almost always: "Was it the model?" Engineering teams pull up output logs. They inspect the prompt. They tweak temperature. They swap in a newer model.
This is the wrong reflex.
The model is usually the last place execution breaks down — and it's the most visible place, so it gets the most attention. Completion logs tell you whether an agent finished. They don't tell you what happened in between: which tool call returned a malformed result that got silently passed downstream, where context got truncated mid-chain, or which orchestration step created a retry loop that drove latency up by 4x.
The monitoring strategy most teams use is built for a simpler architecture. Request in, response out. LLM call in the middle. Watch the response.
That model doesn't hold once you're running multi-step agents with tool use, context hand-offs, and parallel execution paths. The execution graph is where the action is. And the execution graph is what most teams can't see.
What the Span Data Shows
Across 801 production sessions, we instrumented 6,101 spans. Each span represents a discrete unit of execution: an LLM call, a tool invocation, a context operation, an orchestration step. 622 traces captured the full execution path end-to-end.
The failure distribution that emerged from this data is not what most teams expect.
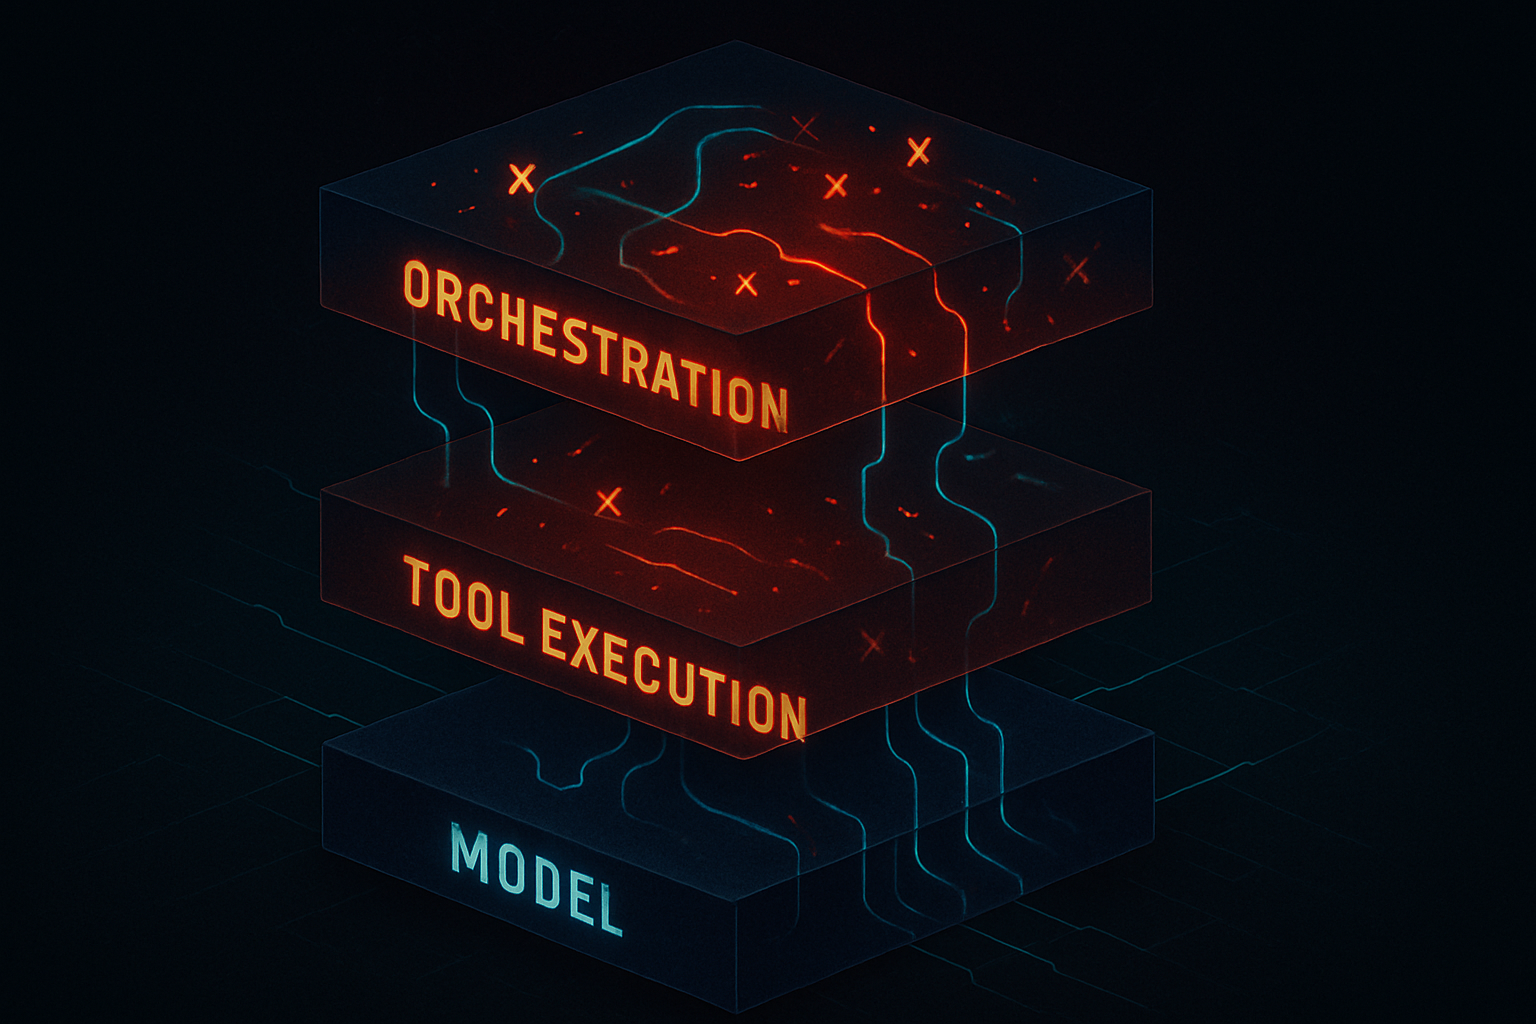
Failures cluster at orchestration and tool execution — not at the model layer. The LLM call itself is typically the most reliable part of the execution chain. What breaks is everything around it: tool calls that return errors handled too permissively, context operations that drop information at hand-off boundaries, orchestration logic that creates race conditions under production concurrency.
This pattern held across session types. The specific breakdown varies by workflow complexity, but the direction is consistent: the model isn't where your agent is failing. The layer you're not watching is.
This matters because it means debugging at the wrong layer — adjusting prompts, swapping models, tuning parameters — doesn't resolve the underlying issue. It masks it temporarily, or not at all.
The 23.4% issue improvement rate we've tracked didn't come from model changes. It came from instrumenting the execution graph and finding where failures actually concentrated.
Why Testing Hides This
If you've run your agents through a test suite and they performed well, that test data is probably misleading you.
Staging environments have three structural problems when it comes to agentic AI:
Concurrency is lower. Production agents handle overlapping sessions, competing for shared context, tool rate limits, and downstream resources. Staging typically doesn't replicate this. Orchestration failures that emerge under production load don't show up in a sequential test run.
Context is simpler. Test cases use clean, well-formed inputs. Production sessions accumulate messy, partial, and contradictory context — especially in long-running agents that operate across multiple turns or persist state between calls. The context hand-off bugs that matter in production don't exist in test data.
State doesn't persist. Long-running agent state creates its own class of failure modes. Context grows, ambiguity compounds, earlier decisions constrain later ones in ways that aren't visible until the session has been running for a while. Short test sessions don't surface these.
The result: your test suite confirms your agent works under ideal conditions. Production is not ideal conditions. The delta between those two environments is exactly where your reliability problem lives.
The Observability Gap That Matters
There's a specific distinction worth naming: span-level observability versus request/response logging.
Request/response logging tells you what went in and what came out. For a simple LLM application, that's sufficient. You can reconstruct what happened from the inputs and outputs.
For multi-agent systems, it's not sufficient. The execution graph between input and output is where the work happens — and where it fails. Span-level instrumentation maps that graph. Every tool invocation. Every context operation. Every orchestration decision. Every retry.
The difference between these two instrumentation approaches is the difference between knowing your agent completed and knowing your agent ran correctly — a meaningful distinction, but not the core one.
Without span-level visibility, you're doing forensics with half the evidence. You can see that something went wrong. You can't see where in the chain it went wrong, or why. You're reduced to guessing — which is where most teams are.
What the 6,101 spans show is where failures actually concentrate: orchestration and tool execution, not the model layer. That distribution only becomes visible at the span level. And it's the distribution that determines whether your debugging efforts land.
What Changes When You Can See the Execution Graph
Teams that instrument at the span level find their debugging workflow changes fundamentally. Instead of starting from symptoms — bad output, slow response, unexpected behavior — they start from the trace. They can see exactly where in the execution chain the failure occurred, what state the agent was in at that point, and which upstream decision contributed to it.
This changes not just how you debug but how you build. When you can see where execution concentrates and where it breaks, you make different architectural decisions. You instrument different things. You write different error handling. You test for different conditions.
The 801 sessions and 6,101 spans we've tracked are ncubelabs' own production agent infrastructure — not a benchmark, not a synthetic dataset. The patterns are from real executions under real production conditions. The 23.4% improvement came from visibility, not from better prompts.